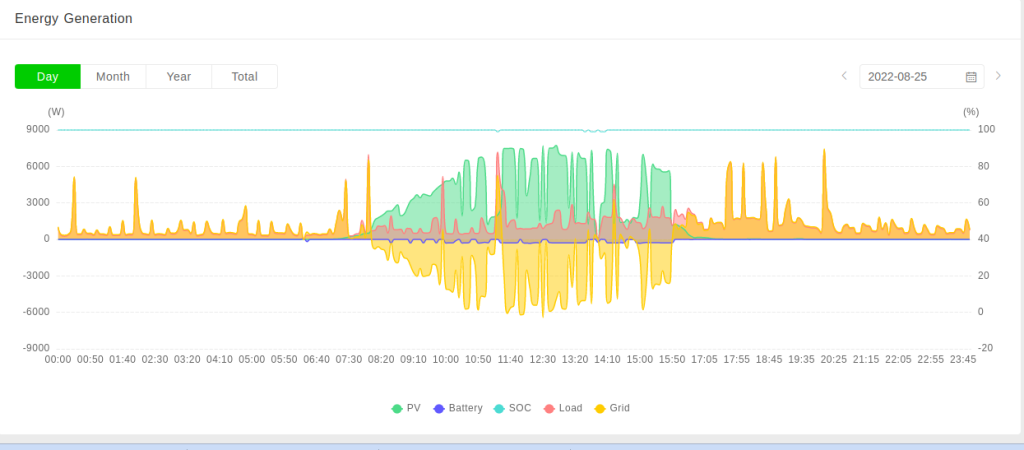
The screen shot shows a typical August day in Florida solar and power demand variation. The green is the solar power input, yellow is the grid power and red is the load. When solar power is not available the grid matches the power demand so the red power demand and yellow grid power become an orange color in the morning before sunrise and evening after sunset. Power is going to the grid during the day as indicated by the negative going grid power (yellow in the center). But since the solar power does not meet the demand when the demand is high and solar is low, the grid provides continuous power to fill in when solar is not adequate to demand. In order to have a net power production, your solar power capability must be higher than your average demand. So for example if you have a continuous average demand of 3000 watts, you will need at least that much average power from your solar panels. Peak power is the maximum your panels can produce when everything is optimal meaning that the sun rays are incident on the panels directly and there are no clouds or other atmospheric interference such as smoke etc. To have an average of 3000 watts you need about twice that much peak power production.
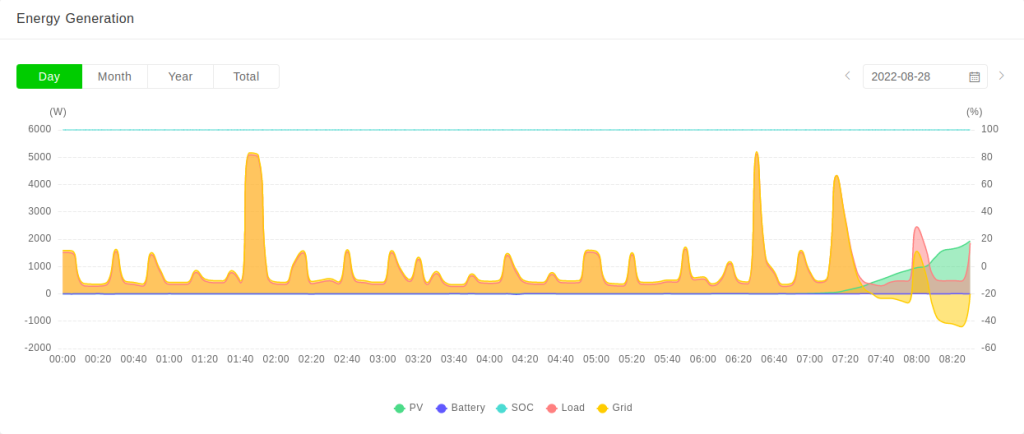
The above early morning power demand shows the solar production matching the home consumption before sunrise followed by the slow rise in solar power (green).